August 31, 2025
I've long wanted to develop a music making interface where I can draw as primary input, and construct music in a bottom up fashion. This means first drawing a timbre, then a melody, then arranging melodies and different parts, all by sketching these individual objects.
What is Timbre?
A first pass definition of timbre is that it is the 'distinguishing character of a musical sound independent of pitch'. As an example, consider that classical instruments like pianos and brass instruments have some articulable characteristic sonic qualities (warm, buzzy, vibrato) regardless of what 'note' might be played. So to construct a timbre, we need some precision about how sounds vary besides pitch. We hear sound, so as a sense it has a duration over which it is present. Sound varies in intensity by loudness and discordance. Loudness is the aural degree of stimulus, and discordance is the conflict of the parts of the sensory gestalt.
To my surprise at ever recurrent consilience of all things, many throughout the history of music, psychoacoustics, physics, and more narrowly, signal processing have contemplated these aspects of timbre. What follows is more or less a summary of their ideas.
Sound is the perceivable vibration of a physical media over time and space. Typically the producing media is some localized object, and the conducting media that carries the sound from its source to us is the air. Sounds reach our ears from the result of some primary physical process, and then there is a secondary physical process that transduces said phenomena into a percept. This involves the anatomic structure of the ear, which contains the cochlea, a spiral-shaped chamber filled with fluid that sloshes back and forth along the length of the spiral according to the pressure exerted upon one's eardrums. Humans are sensitive to the rate of oscillation induced by this sloshing; we call this rate frequency (\(f\)) and it is measured in hertz (\(\text{Hz}\)) - cycles per second. However, most sounds due to finite duration (\(f =0\) when not present) and complexity contain multiple oscillations with different frequencies. We can measure the vibrating air pressure at our ear over time, \(P(t)\), and express it as a weighted sum of shifted sinusoidal functions, called partials, of different frequencies in the following way:
\begin{equation} P(t) = \sum_{i=1}^N A_i \sin(2\pi f_i t + \phi_i). \end{equation}
Here, the weights, \(A_i\), also referred to as amplitude, relate to the loudness of each component, and the phase shifts, \(\phi_i\), determine the temporal offsets between different components. The lowest frequency, \(f_0 := \min_i f_i\), referred to as the fundamental frequency is often (but not always) what we perceive as the pitch of a sound. So pitch and frequency are distinguishable: the former is a property of a perceptual gestalt and the latter is a measurable property of a partial.
I found this model had low timbral expressivity when I attempted to answer the following questions by experiment:
- What is my sensitivity to the intertemporal offsets captured by the phases?
- What is the timbral expressivity of drawing one cycle of a periodic waveform?
- What is the timbral expressivity of drawing to specify the weighting of partials?
The first experiment was motivated by reading the heated debates in audio gear forums about if and when phase was audible. I took a square wave with known amplitudes and phases, and subjected it to variations in phase while preserving the relative amplitudes to distort \(P(t)\). Given the finite motion allowed for a speaker, I normalized my signals by the maximum value of \(P(t)\) to ensure no saturation - this is the sense in which the relations between amplitudes were preserved. I could not perceive any differences, so if there was something of interest for me to draw, it would not involve the phases.
The second experiment was driven by the notion that \(P(t)\) as a function of time ought to be directly drawn, and periodicity would capture the notion of oscillation. It turned out that this was not very interesting in the kinds of sounds I could produce, and at best I could make sounds similar in character to those from the early days of digital audio synthesis: sine waves, square waves, ramp waves, and triangle waves. While these were distinguishable, they could not capture the complexity of sounds producible by traditional musical instruments, and this was for the following assumptions:
- \(P\) is necessarily periodic.
- The features which contribute to \(P\) have comparable amplitude.
- The features which contribute to \(P\) occur on the same time scale.
- Thus, functions \(P(t)\) can be drawn in single stroke fashion and thus capture the previous two points.
This is not to overlook the variety of loved and amazing works in the chiptune and digital fusion scenes (see sertraline - miles morkri & aivi and roots of ruin - rei8bit, covered by nanka8bit), but rather that the gamut of sounds (aurome?) is richer than the palette offered by the constraints of the digital chips of the 80s. This is because the human senses allow us to discriminate logarithmically, both in amplitude and time. What we perceive as linear steps in volume and pitch turn out to be exponential changes in amplitude and frequency. In this way, timbre has features occuring at multiple resolutions. This is also paralleled in the displeasure one might experience at how photos at times fail to capture the beauty of scenery as our eyes have such amazing dynamic range in brightness that we may perceive colors that fall short of the sensitivity of a camera's sensor.
I digress: In my earlier days thinking about this in 2023 when I was wayward in my waking hours, I envisioned a progressive series of operations by blocks à la functional programming, NXT-G's node based programming, and Andrew Huang's explanation of FM synthesis with FM operators. In these blocks I would filter, add dynamic envelopes, or apply any other number of effects to a sound. Then with this sound character plugged into a piano roll block, I would draw to sequence notes. The next block would be a multi-track interface which would allow you to do arrangement of different musical phrases. I have since been sorely disabused of the notion that there needs to be yet another block-based interface, and the spark of this project lies in fast sonic expressivity by drawing. Such a block-based system would not be entirely original either: Alexander Zolotov has made a wonderful block-based DAW called Sunvox which has the capability to draw waveforms.
If timbre was not expressible by sketching the shape of \(P\) in time, what view of \(P\) could capture any timbre? In learning that the cochlea has different regions sensitive to different frequencies organized by extent along the spiral, the balance of partials, the \(A_i\), must be responsible for the character of the sound. The third experiment was to then draw the spectral envelope, a continuous curve, on which the discrete weights \(A_i\) lie. I also kept the assumption that \(P\) be periodic by choosing my frequencies to be the whole number multiples of the fundamental frequency, \(f_0\).
This experiment gave more interesting sonic characters than by drawing a waveform, but I still had my gripes. I was annoyed by the visual metaphor of using sliders for controlling the fundamental frequency. It felt odd when I had set out to make an interface where I drew everything. The metaphor was also static: how would I take this sound and place it in a musical context? The power of western sheet music's staff notation is in how it captures both pitch and duration, and sounds exist in relation to each other in these properties. Contrastively, I was intrigued that you could see in a spectrogram the temporal variations of the spectral envelope, and these features were audible! I wanted to capture properties of the sound, like vibrato, by drawing. The punchline: I needed frequency, I needed amplitude, and I also needed to capture temporal variation of both.
Those familiar with the signal processing notion of the Fourier Transform likely have come across the notion that a function of time should be uniquely (and thus sufficiently) determined by the balance of what different frequencies it contains. There is a slight paradox, then, that drawing a spectrum should NOT be sufficient for composing a timbre, a melody, or a song. However, the weakness of this mathematical framework as applied to something which has sparse features in time (i.e., features which are localized), is that in changing view to a different independent variable entirely, all localization and variation in the previous independent variable is lost. This ends up also being similarly true of the new independent variable (frequency). So, like sheet music, the power of a spectrogram is in that it shows the short term frequency content of a sound - percepts and their variations can be located in both time and frequency!
To, yet again, no one's surprise, living or dead, this has been thought about and written about. See the following excerpt from R. Murray Schafer's (who I'll hereafter refer to as R) The Tuning of the World (pp. 124-125).
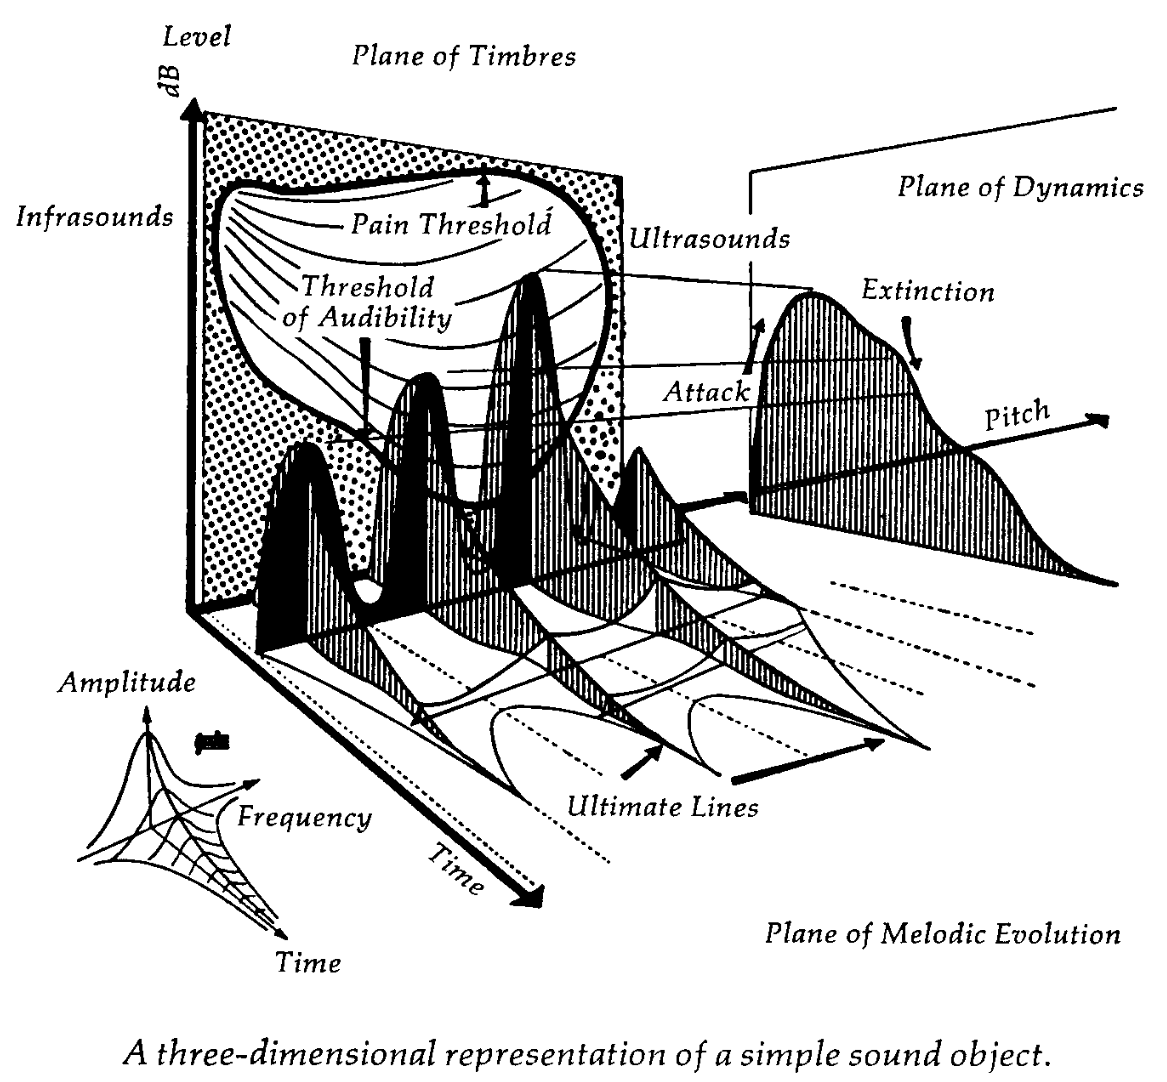
"For sounds to be given exact physical description in space, a technology had to be worked out by which basic parameters could be recognized and measured in exact, quantitative scales. These parameters were time, frequency and amplitude or intensity. The fact that these three parameters have been identified as in some sense basic should not lead us to believe that this is the only conceivable method by which a total description of the behavior of sound is possible. At any event the three chosen parameters should never be regarded as isolable or independent functions. At least as far as our perception of them is concerned, they are in constant interaction. For instance, intensity can influence time perceptions (a loud note will sound longer than a soft one), frequency will affect intensity perceptions (a high note will sound louder than a low one of the same strength) and time will affect intensity (a note of the same strength will appear to grow weaker over time) - to give just a few examples of interaction. In introducing students to the properties of sound I have noticed frequent confusion between notions as elementary as frequency and intensity and have come to the conclusion that the standard acoustic diagram is not only ambiguous but for some people, at least, may not correspond at all with the natural instincts of aural perception. The problems between acoustics and psychoacoustics may never be clarified as long as the 3-D acoustic image continues to be regarded as an inviolably accurate model of a sound event.*"
They follow this by talking about how the spectrogram allows the visualization of these three parameters.
This picture motivates the following model: \begin{equation} P(t) = \sum_{i=1}^N A_i(t) \sin\left(2\pi \int_0^t f_i(t')dt'\right). \end{equation}
I posit that a unique timbre should be characterized by its partials with changing instantaneous frequencies, \(f_i(t)\), and with changing amplitude, \(A_i(t)\) (changing volume, i.e. dynamics).
Is this enough? What kinds of possible structures should this math capture? FM synthesis gives some credence that one can get a number of interesting timbres by modulating instantaneous frequency in this way. Bill Sethares in Tuning, Timbre, Spectrum, Scale (p. 28) also offers the following summary of factors that distinguish between different timbres perceptually:
- Degree of synchrony in the attack and decay of the partials
- Amount of spectral fluctuation
- Presence (or absence) of high-frequency, inharmonic energy in the attack
- Bandwidth of the signal
- Balance of energy in low versus high partials
- Existence of formants
While I believe all of these are accounted for by both \(f_i(t)\) and \(A_i(t)\), what is left is to come up with a compelling interface for depicting and manipulating these. An earlier prototype of a timbre editing interface I made appears as follows. On the horizontal axis you have time, and in the vertical axis you have frequency. You can draw partials, and zoom and pan in both axes. However, you can only hear one partial at a time.
The issue this instance of the interface presents was that there was no way to specify the \(A_i(t)\), as R foresees not even a full page later: the spectrogram is a 3-dimensional object.
"While theoretically it ought to be possible to plot N+1 dimensions in an N-dimensional space, in practice the placement of the three dimensions of sound on the two-dimensional space of paper results in formidable reading problems."
At this point I was absolutely stumped for how to include the dynamics and the changing spectral envelopes. Despite my later attempts, I remain stumped. At the time of writing this and reading R some more, I am also amused by the folly of this particular rendition of the thrust of my project:
"If I have kept my enthusiasm for sound visualization under control up to this point, it is simply because I want the reader to remain alert to the fact that all visual projections of sounds are arbitrary and fictitious."
R and others aren't unexcited about sound visualization; see their graphical scores.
All the while I can only laugh at myself and take the following as a read.
"[...] while the science of acoustics has advanced greatly since the nineteenth century, the listening abilities of average mortals have not shown corresponding improvement. In fact, they may have deteriorated in inverse proportion to the pictorialization of sound.
Today, many specialists engaged in sonic studies - acousticians, psychologists, audiologists, etc. - have no proficiency with sound in any dimension other than the visual. They merely read sound from sight. From my acquaintance with such specialists I am inclined to say that the first rule for getting into the sonics business has been to learn how to exchange an ear for an eye. Yet it is precisely these people who are placed in charge of planning the acoustic changes of the modern world."
Interlude: What's been done?
Meanwhile, in the waking world, I spoke with a variety of friends about these weird dreams I was having. ES, with encyclopedic knowledge on synths and music tech, told me about Oramics, Sumu/Vutu, and Melodyne. Digging into Vutu, I learned of Loris and SPEAR. ES and SB told me about Metasynth. I found out about Bill Sethares' work from a minutephysics video on dissonance from JL. I learned about R from Inju. Time spent in Calgary after BV's wedding led to trying out the Yamaha DX7 and learning about Oscar Peterson's life and work at Studio Bell. I rushed to complete yet another prototype for show-and-tell at AC's party.
There are a myriad of notes I've been taking about my experiences with each of these works in how I wish to differentiate this project from them or shamelessly copy from them, but what drew the most of my attention was Daphne Oram's writing on what she envisioned for her Oramics machine.
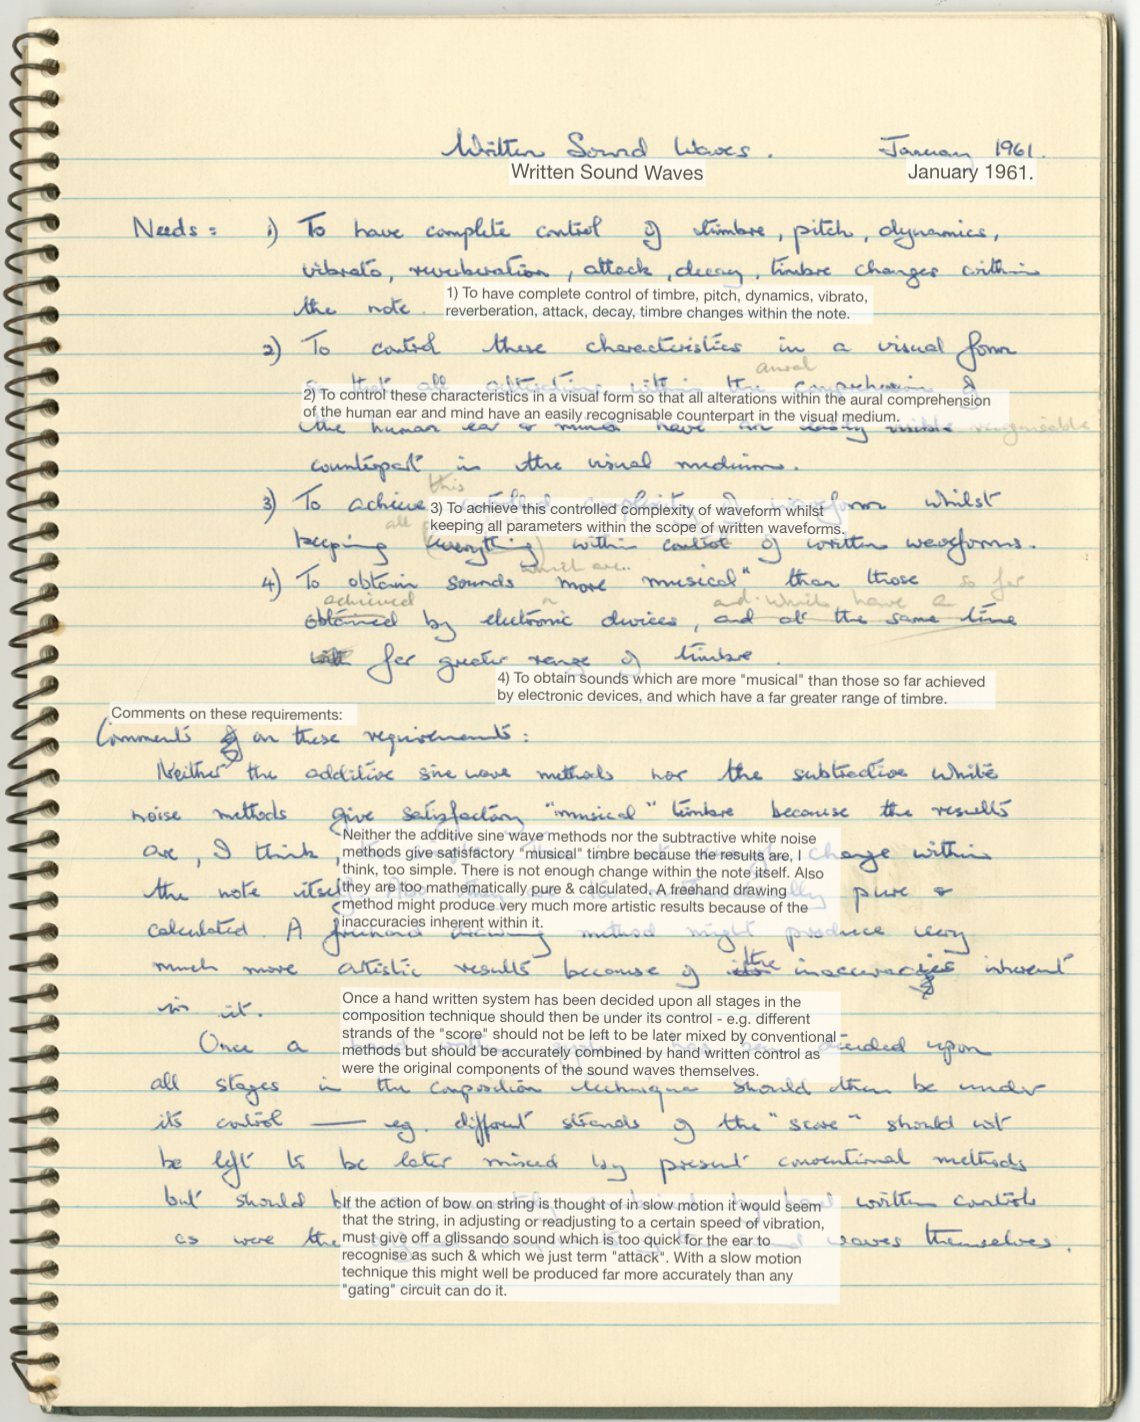
WOW! - what a powerful articulation! After reading this, I was left with the strong sense that the traces of people past left in writing is a bridge that transcends time. You are not alone! Poetry aside, these are some principles that I want my interface to eventually follow:
- Draw all your music.
- Everything is a spectrogram.
- Hear results quickly.
- Do analysis for resynthesis.
- No swimming through dropdowns or knobs.
- Novices can use it.
What is a Melody? What is a Composition? What is everything?
Given an instrument with a timbre, one may use it to play a melody. Certain percussion instruments serving rhythmic roles have less discernable pitches, yet I will still group their timbres in the notion of melody; so to me, a melody is a sequence where a timbre is modulated to different pitches. Once one has a melody, one may have a sequence of melodies (some, simultaneous) and these compose, well, a composition.
I long had the idea that I wanted to draw a melody in a piano roll, but that somehow marking bars in an DAW's piano roll interface was constrained in a way that felt locked to the flavor of WIMP-y interfaces. It also occurred to me from SPEAR's metaphor of drawing partials as lines and its similarity to notes on a piano roll was not a fluke. Similarly, the multi-track interface in a variety of DAWs (FL Studio, Cubase, Logic, Ableton) also had the same structure as a piano roll - different voices were audible at simultaneous or different times.
The issue was that SPEAR, as essentially a spectrogram of the entire content of some sample, was crowded with the overtones (higher partials) of timbres, that one could not easily distinguish between timbres, melodies, or tracks. Out of the desire for a sparse representation to see these components, I realized that melody has the same structure as timbre, which has the same structure as a composition: the components of these musical objects are located in time and modulated to different frequencies, and also themselves have components with such organization. This is another sense in which music has multiple resolutions: music has a self-similar structure. Consider how this might apply to timbre: partials have an onset and decay out at different times, have different frequencies, and often exist simultaneously to impart a character to sound. In melody: notes of an instrument with a specific timbre are played in sequence at different fundamental frequencies, and with polyphony can form chords. In composition: melodies from different instruments are played throughout time and often occupy different frequency ranges to harmonize. Mathematically, we can pose this as:
\begin{equation} T_n(t) = \sum_{i=1}^{N_T} A_i(t) \sin\left(2\pi \int_0^t n\cdot f_i(t')dt'\right). \end{equation}
\begin{equation} M_n(t) = \sum_{j=1}^{N_M} A_j(t) T_{n\cdot n_j}(t) . \end{equation}
\begin{equation} C_n(t) = \sum_{k=1}^{N_C} A_k(t) M_{n\cdot n_k}(t) . \end{equation}
What's different from the previous model is now a similarity between timbre, \(T\), melody, \(M\), and composition \(C\): you take a sum of modulated (by \(n\)), enveloped (by \(A_\square\)) sound objects from the most basic sine to a melody.
While neat, there's something missing from the math here which continues to rub me wrong. As my expressions are written, this would be for a single track for a single kind of instrument with a single kind of timbre. At the composition level, different melodies \(M\) from different instruments should meet, and one should be able to represent them simultaneously in an interface to make coordination of harmonization or rhythm easy - in fact, this is my criticism of the conventional multi-track editing model as it exists in DAWs and why I love how the simple and cute interfaces like those of ALMAMPlayer and Mario Paint Composer afford the desired juxtaposition of tracks. I think this is solved by precise quantization and alignment in DAWs, but I have my own partial answer to this friction that I'll save for an article about my latest prototypes.
Conclusion
The imagined design of my drawing-based interface hinges on this observation and thesis that the relationship between the atoms that compose timbre is the same relationship that timbre has to melody, and perhaps the same relationship that different melodies might have to an arrangement.
In a quick conversation with ES and SB, who have expertise in music and production, I was exposed to the notion that this bottom-up modularity seemed to be wholly at odds with how music is made in practice, where something like an electronic instrument produces MIDI messages, and this sent data determines sound generated by other hardware in a top down approach. I have a soft hunch that this is a quirk of the history of digital instrument development, where computational power and the ability to manufacture chips were the initially constrained quantities. Anyways, Ciao!